Accusation Histogram Discussion
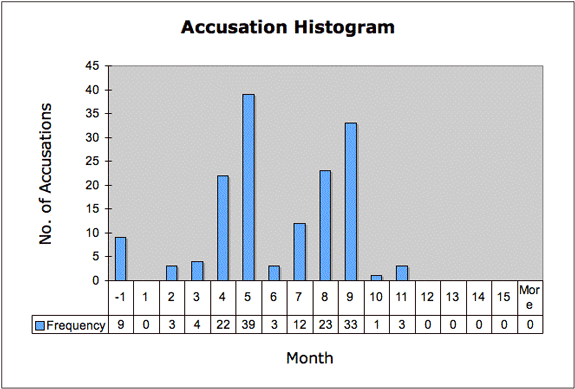
The accusation histogram illustrates important dimensions of the chronology of Salem Witchcraft. The earliest formal accusations occurred in February 1692, when three people were accused; the last three victims were charged in November 1692. The chart also reveals striking patterns in the accusations. Accusations did not erupt in substantial numbers right away, and they did not occur evenly over the course of the outbreak. Not until April did substantial numbers of accusations (twenty-two) occur, indicating that for at least a month after the initial charges, the outbreak remained a small-scale event, similar to other, limited witchcraft incidents of colonial America. But instead of subsiding, as generally happened with witchcraft incidents, a wave of accusations took place in April and May. This was followed by a dramatic drop off in June. After June, a second wave of accusations erupted, which spiked in September and declined precipitously in October, with only one registered accusation. Since there were only a few accusations in November and none thereafter, it is clear that October marked a turning point and the effectual end of the Salem witch hunt.
A basic histogram of accusations reveals two distinct waves of accusations, one peaking in May, the other in September 1692. Although it does not explain Salem's ebb and flow of accusations, it directs attention to questions that might be addressed by historical sources. What events or actions shifted the initial small-scale affair of February and March 1692 into an unprecedented full-blown witch hunt? Is there an explanation as to why accusations peaked in May and virtually halted in June? When accusations fell in October, why did they not rise again as they had in July? Users are encouraged to explore these issues further in historical sources, but some possible explanations for these findings can be found here.
While a basic histogram reveals a pattern of rising and falling accusations, the data can be displayed in other ways: a cumulative histogram and a Pareto histogram show different patterns that provide additional insight into the chronology of Salem.
Scatter plots are also useful in displaying patterns of accusations. To construct a scatter plot of witchcraft accusations in 1692, click Next.